DC Industries
Overview
To analyze sales data from Retail department store DC Industries to determine the most profitable orders, the most profitable days, and how profits vary by category and region. Additionally, to prepare a master data set for visualization purposes.
What were the top 25 most profitable orders?
What day of the week is most profitable?
How do the profits vary by category and region?
What sub-categories contributed to the most profit in each category?
Data
Data Set
The dataset consists of sales records from DC Industries, a retail department store operating across three regions in the U.S. The data includes customer orders, order details, and regional information. This dataset provides a detailed view of the company's sales performance and customer behavior over a specified period.
Process
Data Cleaning:
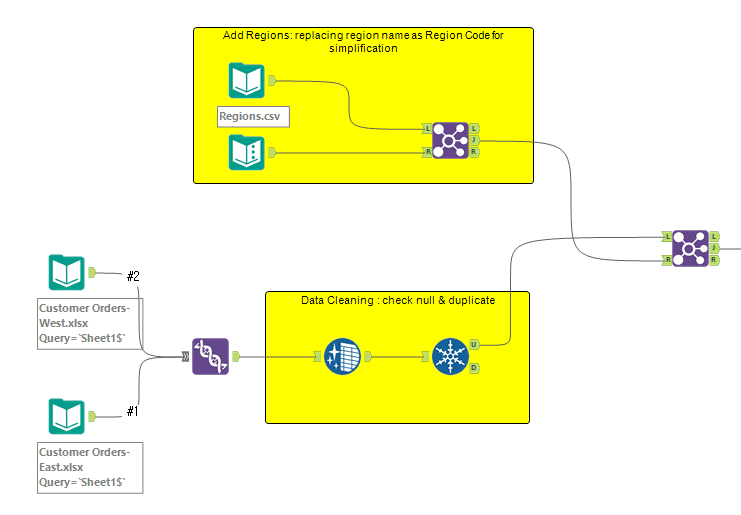
Combined customer order files from different regions.
Removed duplicate records to ensure data accuracy.
Added region and day of the week information to the dataset.
Generated a regional counts file for detailed analysis.
Descriptive Analysis:
Pivot Tables: Used pivot tables in Excel to summarize and analyze the data, providing insights into order counts, sales performance, and customer distribution across regions.
Functions: Employed various Excel functions for statistical analysis and data manipulation to extract meaningful patterns and trends.
Key Analysis
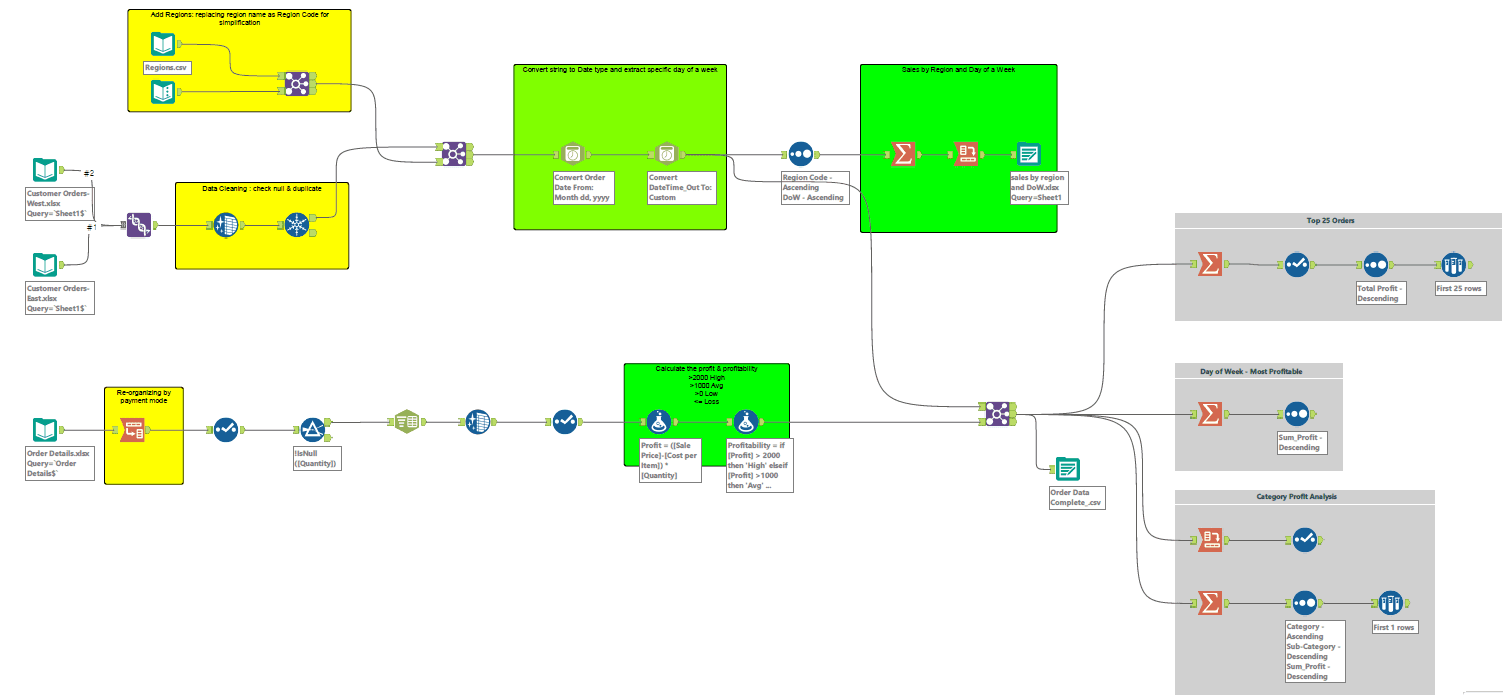
Work Flow
Data Cleaning and Joining Data
Create Profit & Profitability column by Function tool
Key Findings
Top 25 Most Profitable Orders: Identified based on the profit margins derived from sales and cost data.
Most Profitable Day of the Week: Analyzed order distribution and profits by the day of the week.
Profit Variation by Category and Region: Provided a detailed breakdown of profits by product categories and regions.
Sub-Categories with Highest Profits: Determined the top-performing sub-categories within each main product category.


